
The 2022 ATAR Report was published by QTAC on 31 January 2023 and is now available on the QTAC website. Download your copy here.
The annual ATAR Report provides an overview of the calculation of the ATAR and scaling outcomes for the previous year’s Year 12 student cohort. In line with the 2020 and 2021 ATAR Reports, the 2022 Report contains a summary of subject enrolments, the outcomes of the inter-subject scaling process for each subject, as well as the allocation of students to ATAR bands. The format and overall content of the report has been kept the same as in previous years to make it easy for people to follow trends and to make comparisons across the years.
For more information about the calculation of the ATAR, see the Calculating the ATAR in Queensland: Technical Document available on the QTAC website.
2022 ATAR Insights at a glance
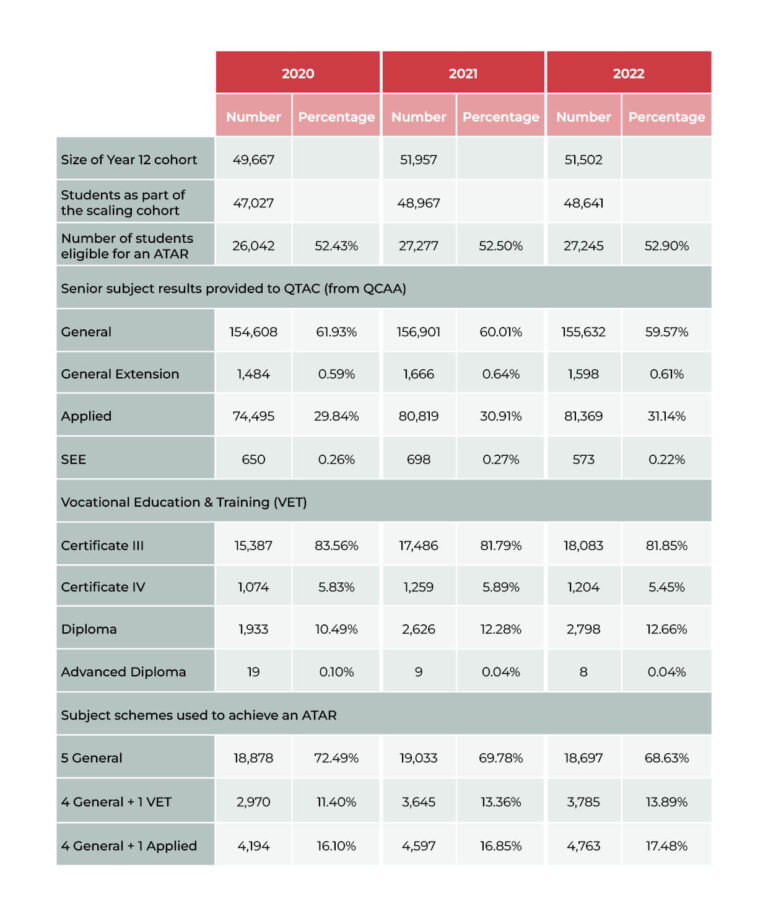
The summary below compares key ATAR statistics for the 2020, 2021 and 2022 Year 12 cohorts – the first three years of the introduction of the Queensland ATAR.
27,245 students qualified for a Queensland ATAR in 2022. At 52.9%, this was marginally higher than in previous years.
Qualifying for the ATAR
From 2020 to 2022 there has been an increase in the number of students qualifying for the ATAR on schemes other than with 5 General subjects. The number of Year 12’s qualifying for an ATAR through the schemes 4 General + 1 Applied subject is up 1.38%, and those getting their ATAR under the 4 General + 1 VET qualification is up 2.49%.
8,548 students, or 31.3% of the ATAR-eligible cohort, received an ATAR based on their VET or Applied subject in combination with 4 General subjects. There has been a corresponding decrease in those qualifying with 5 General subjects. This is a positive indication that the ATAR scheme is encouraging students to follow study pathways other than with only General subjects.
Subjects and Qualifications studied
The most studied subjects in 2022 for each subject type were English (General), English and Literature Extension (General Extension), Chinese (Senior External Examination) and Essential English (Applied). The most frequently completed VET qualifications for each AQF Level were the Certificate III in Fitness, the Certificate IV in Crime and Justice Studies, the Diploma of Business and the Advanced Diploma of Professional Dance (Elite Performance).
Summary of key statistics across the first three years of the ATAR in Queensland
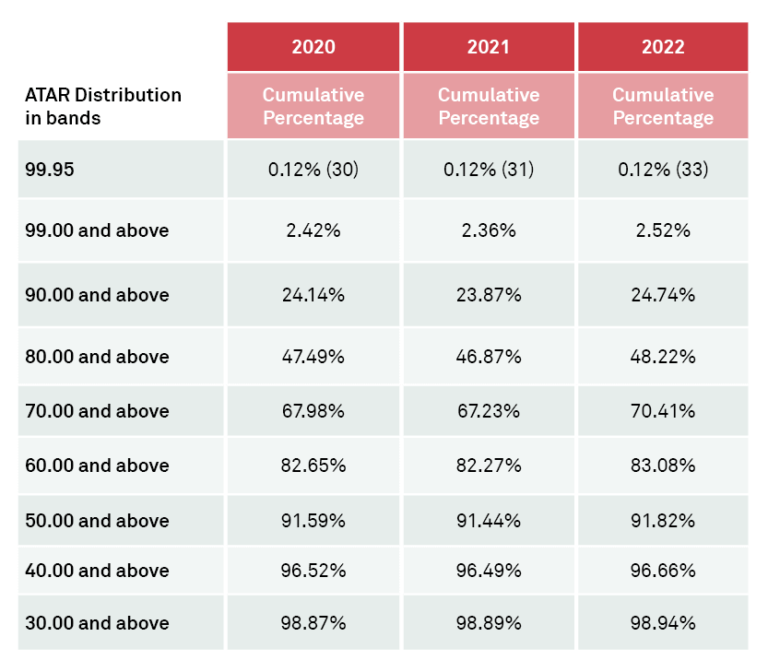
ATAR Distribution
During the ATAR calculation process the allocation of ATARs to different bands is done according to the set formula. As can be seen from the table below, the ATAR distribution is similar year on year, and the small changes in numbers of students fitting into the different ATAR distribution bands reflect the changing population of ATAR–eligible students.
ATAR Scaling
When compared against the previous two years, the 2022 scaling outcomes for individual subjects confirm that the cohort achievement and scaling for subjects changes from year to year and to varying degrees. The Distribution of Raw and Scaled Results for all subjects in 2022, as presented in Tables 7, 8 and 9 in the ATAR Report, show that while there is similarity in scaling outcomes across the years, there is no set pattern or ‘predictability’ in how different subjects might scale when compared to previous years.
**When reading this report and interpreting the data, it is imperative to observe the following:
- Inter-subject scaling is the process undertaken to map each QCAA subject and completed VET qualification to a common scale. This allows raw results in different subjects to be compared fairly.
- Subject Scaling is a comparative measure based on actual subject achievement data and is expected to be different from one year to the next based on the capability of the student cohort for each year. QCAA subject results are the true achievement levels.
- The performance of students in each subject, each year determine the scaling of a subject. Students should not select subjects based on predicted scaling outcomes but should choose subjects they enjoy, are good at and which meet any prerequisites for courses they want to apply for.
- QTAC does not endorse any ATAR calculators to help identify whether a student is on track to receive a particular ATAR. Calculating the ATAR is a data-driven process and schools need to be wary of calculators, as those calculators will not have access to the actual data which is used to calculate final ATARs. Although trends will form, schools, students and parents are advised not to use historical scaling data to predict future outcomes.